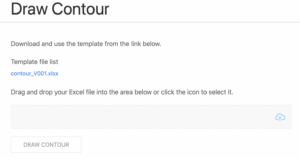
Entry Page
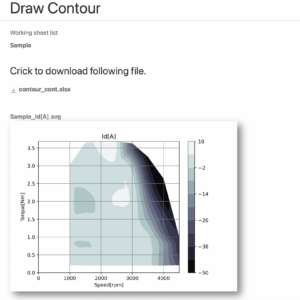
Result Page
Draw a contor graph in the .xlsx file
2軸で定義された粗めのデータ配列から補間演算をしてコンター図を作成する。fastAPIを使用した作例。ローカル環境でのみ動作確認した。
他のプラットフォームへの実装についてはstreamlitを利用した作例がある。
streamlitへの実装例
データフローを下図に示す。contour_template.xlsx にデータを登録する。Web Appにアップロードし計算後に結果ファイルをダウンロードする。結果ファイルにはコンター図が挿入される。
graph LR
    indata[input data]
    temp[contour_template.xlsx]
    src[input.xlsx]
    web[Web<br>Interpolating &<br>drawing contour]
    dist[input_cont.xlsx]
    indata --> src
    temp --> src
    src --> web --> dist
動作確認環境
ローカル環境で動作確認したときの各バージョン情報
python=3.10.14
numpy==1.26.4
matplotlib==3.9.1
openpyxl==3.1.4
scipy==1.11.1
fastapi==0.112.0
uikit==3.6.3
Directory Tree
ローカル環境のディレクトリ構成。
contour/
├── static/
│   ├── css/
│   │   └── uikit.min.css
│   └── js/
│       ├── uikit-icons.min.js
│       └── uikit.min.js
├── templates/
│   ├── base.html
│   ├── main.html
│   └── repotr.html
├── template/
│   └── contour_template.xlsx
├── work/
├── main.py
└── contour.py
Template file
計算条件と基となるデータはエクセルに入力しアップロードする。そのためのテンプレートを用意しておく。
Source code
エンドポイントの定義
main.py
import uvicorn
import os
import socket
import glob
import platform
import json
import openpyxl as px
import contour
import tempfile
from fastapi import FastAPI, Request, Response
from fastapi.responses import HTMLResponse, FileResponse, JSONResponse
from fastapi.staticfiles import StaticFiles
from fastapi.templating import Jinja2Templates

PORT = 9000

WORK_DIR = 'work'
INFO_FILE = 'info.json'
COOKIE_KEY = 'contourtmpdir'

BASE_DIR = os.path.dirname(os.path.abspath(__file__))

PLATFORM = platform.system()
if PLATFORM == 'Windows':       # windows
    HOSTNAME = socket.gethostname()
    DIR_SEP = '\\'
elif PLATFORM == 'Darwin':      # my mac
    HOSTNAME = 'localhost'
    DIR_SEP = '/'
elif PLATFORM == 'FreeBSD':     # freebsd
    HOSTNAME = 'somedomain.net'
    DIR_SEP = '/'
elif PLATFORM == 'Linux':       # Linux
    HOSTNAME = socket.gethostname()
    DIR_SEP = '/'
else:
    raise('Error: Unknown platform.')

app = FastAPI()
app.mount("/static", StaticFiles(directory="static"), name="static")
templates = Jinja2Templates(directory="templates")

@app.get("/contour", response_class=HTMLResponse)
async def start_contour(request: Request):
    os.chdir(BASE_DIR)
    if COOKIE_KEY in request.cookies:
        request.cookies[COOKIE_KEY] = None

    fs = glob.glob('./template/*.xlsx')
    request.templatefiles = []
    for f in fs:
        request.templatefiles.append(os.path.basename(f))

    request.templatefileurl = f"{HOSTNAME}:{PORT}/contour/download/template"
    return templates.TemplateResponse("main.html", {"request": request})

@app.post("/contour/upload", response_class=JSONResponse)
async def upload_file_xlsx(request: Request, response: Response):
    os.chdir(BASE_DIR)
    form = await request.form()
    uploadf = form['file']
    infor = dict()
    sheets = list()
    fname = uploadf.filename
    workdirpath = tempfile.mkdtemp(dir=os.path.join(BASE_DIR, WORK_DIR))
    tmpdir = workdirpath.split(DIR_SEP)[-1]
    response.set_cookie(key=COOKIE_KEY, value=tmpdir)
    infopath = os.path.join(workdirpath, INFO_FILE)

    os.chdir(workdirpath)
    with open(fname, 'wb') as fp:
        fp.write(uploadf.file.read())

    base, ext = os.path.splitext(fname)
    outfname = base + '_cont' + ext
    os.rename(fname, outfname)
    sheets = getSheetNames(outfname)
    infor = {
        'outfname': outfname,
        'sheets': sheets
    }
    with open(infopath, "w") as fp:
        json.dump(infor, fp)

    return {"infor": infor}

@app.post("/contour/exec", response_class=HTMLResponse)
async def exec_contour(request: Request):
    os.chdir(BASE_DIR)
    form = await request.form()
    tmpdir = request.cookies[COOKIE_KEY]
    infopath = os.path.join(BASE_DIR, WORK_DIR, tmpdir, INFO_FILE)
    with open(infopath, "r") as fp:
        infor = json.load(fp)

    outfname = infor['outfname']
    outfpath = os.path.join(BASE_DIR, WORK_DIR, tmpdir, outfname)

    sheets = form.getlist('sheetname')
    request.sheets = sheets
    request.downloadurl = f"{HOSTNAME}:{PORT}/contour/download/result/{tmpdir}/{outfname}"
    request.filename = outfname
    if len(sheets) > 0:
        contour.contours(outfpath, sheets)
        request.imgurls = []
        imgpaths = glob.glob(os.path.join(BASE_DIR, WORK_DIR, tmpdir, '*.svg'))
        imgpaths.sort(key=os.path.getctime, reverse=False)
        for imgpath in imgpaths:
            imgname = os.path.split(imgpath)[1]
            request.imgurls.append({
                'url': f"{HOSTNAME}:{PORT}/contour/display/{tmpdir}/{imgname}",
                'name': f"{imgname}"
            })

        request.status = 'OK'
    else:
        request.status = 'Error'

    return templates.TemplateResponse("report.html", {"request": request})

@app.get("/contour/download/template/{filename}")
async def download_file_template(filename):
    fpath = f"{os.getcwd()}/template/{filename}"
    return FileResponse(fpath)

@app.get("/contour/download/result/{workdir}/{filename}")
async def download_file_result(workdir, filename):
    fpath = os.path.join(BASE_DIR, WORK_DIR, workdir, filename)
    return FileResponse(fpath)

@app.get('/contour/display/{workdirpath}/{filename}')
def display_img(workdirpath, filename):
    fpath = os.path.join(BASE_DIR, WORK_DIR, workdirpath, filename)
    return FileResponse(fpath)

def getSheetNames(workFilePath):
    wb = px.load_workbook(workFilePath)
    sheets = wb.sheetnames
    return sheets

if __name__ == "__main__":
    uvicorn.run("main:app", host="0.0.0.0", port=PORT, reload=False)
openpyxl を利用してエクセルファイルを操作する。補間は scipy の interpolate を使用しグラフは matplotlib で描画した。
contour.py
#!/usr/bin/python3
# -*- coding: utf-8 -*-
"""
V012: Support for processing multiple sheets.
"""
import os
import datetime
import numpy as np
import openpyxl as px
import matplotlib.pyplot as plt
from scipy import interpolate

E_SAVECSV = True

HEADER_POS = 'C5'
GRAPH_POS = 'M6'
GRAPH_POS_DEF = 26
N_POINTS = 2000
N_LEVEL = 11     # N + 1

def is_num(s):
    try:
        float(s)
    except ValueError:
        return False
    except TypeError:
        return False
    else:
        return True

def contours(outfpath, sheets):
    starttime = datetime.datetime.now()
    for sheet in sheets:
        contour(outfpath, sheet)

    endtime = datetime.datetime.now()

def contour(fpath, sheet):
    global x, y, z, zz, n_z, n_data, x_label, y_label, z_label, methods, cmaps

    set_parameter(fpath, sheet)
    wb = px.load_workbook(fpath, data_only=False)
    ws = wb[sheet]
    wb.active = ws
    make_contour(fpath, ws)
    wb.save(fpath)
    wb.close()
    if E_SAVECSV == True:
        workdir = os.path.dirname(fpath)
        np.savetxt(os.path.join(workdir, sheet + '_nt_eta_x.csv'), x, delimiter=',')
        np.savetxt(os.path.join(workdir, sheet + '_nt_eta_y.csv'), y, delimiter=',')
        np.savetxt(os.path.join(workdir, sheet + '_nt_eta_z.csv'), z, delimiter=',')

def set_parameter(fpath, sheet):
    global x, y, z, zz, n_z, n_data, x_label, y_label, z_label, methods, cmaps

    workdir = os.path.dirname(fpath)
    wb = px.load_workbook(fpath, data_only=True)
    ws = wb[sheet]
    wb.active = ws

    x_label = ws[HEADER_POS].value
    y_label = ws[HEADER_POS].offset(0, 1).value
    z_label = []
    methods = []
    cmaps = []
    x = np.array([])
    y = np.array([])
    for col in ws.iter_cols(min_row=5, min_col=5, max_row=5):
        for head in col:
            if not head.value is None:
                z_label.append(head.value)
                methods.append(head.offset(-2, 0).value)
                cmaps.append(head.offset(-3, 0).value)

    for row in ws.iter_rows(min_row=6, min_col=3, max_col=4):
        if is_num(row[0].value):
            x = np.r_[x, float(row[0].value)]
        if is_num(row[1].value):
            y = np.r_[y, float(row[1].value)]

    n_z = len(z_label)
    n_data = np.size(x, 0)
    z = np.array([])
    zz = np.array([])
    for col in ws.iter_cols(min_row=6, min_col=5, max_row=5+n_data, max_col=4+n_z):
        if not col[0].value is None:
            zi = np.array([])
            if np.size(z) == 0:
                for data in col:
                    if is_num(data.value):
                        zi = np.r_[zi, float(data.value)]
                z = np.array([zi,])
                # z = zi
            else:
                for data in col:
                    if is_num(data.value):
                        zi = np.r_[zi, float(data.value)]
                        # z = np.concatenate([z, [zi]])
                z = np.r_[z, [zi]]

    wb.close()

def make_contour(fpath, ws):
    global x, y, z, zz, n_z, n_data, x_label, y_label, z_label, methods, cmaps

    wGraph = ws[GRAPH_POS]
    pos = wGraph

    xmin = 0    # np.min(x)
    xmax = np.max(x)
    ymin = 0    # np.min(y)
    ymax = np.max(y)

    x1 = np.linspace(xmin, xmax + xmax/N_POINTS, N_POINTS)
    y1 = np.linspace(ymin, ymax + ymax/N_POINTS, N_POINTS)
    xx, yy = np.meshgrid(x1, y1)
    zz = np.array([])
    zzi = np.array([])

    for i in range(n_z):
        if np.size(zz) == 0:
            zz = interpolate.griddata((x,y), z[i], (xx, yy), method=methods[i])
            zz = np.stack([zz,])
        else:
            zzi = interpolate.griddata((x,y), z[i], (xx, yy), method=methods[i])
            zz = np.concatenate([zz, [zzi]])

    for i in range(n_z):
        zmax = np.max(z[i])
        zmin = np.min(z[i])
        if zmax < 0:
            lv0 = zmin
            lv0 = -np.ceil(-zmin/10.0)*10.0
            lvf = 0
        elif zmin > 0:
            lv0 = 0
            lvf = zmax
            lvf = np.ceil(zmax/10.0)*10.0
        else:
            lv0 = zmin
            lv0 = -np.ceil(-zmin/10.0)*10.0
            lvf = zmax
            lvf = np.ceil(zmax/10.0)*10.0

        plt.figure()
        plt.contourf(xx, yy, zz[i], levels=np.linspace(lv0, lvf, N_LEVEL), cmap=cmaps[i])
        plt.title(z_label[i])
        plt.xlabel(x_label)
        plt.ylabel(y_label)
        plt.grid(which='major', color='gray', linestyle='-')
        plt.colorbar()
        workdir = os.path.dirname(fpath)
        fpng = os.path.join(workdir, ws.title + '_' + z_label[i] + '.png')
        fsvg = os.path.join(workdir, ws.title + '_' + z_label[i] + '.svg')
        plt.savefig(fpng, format='png')
        plt.savefig(fsvg, format='svg')
        img = px.drawing.image.Image(fpng)
        ws.add_image(img, pos.coordinate)
        pos = pos.offset(GRAPH_POS_DEF, 0)

        plt.close()

if __name__ == '__main__':
    pass
エントリーページのHTMLファイル。
main.html
{% extends "base.html" %}

{% block title %}Main{% endblock %}

{% block head %}
  {{ super() }}
{% endblock %}

{% block content %}
<style>
  .uk-form-custom{
    color:deepskyblue;
  }
</style>
<div class="uk-container">
  <p class="uk-margin-top">Download and use the template from the link below.</p>
  <ul class="uk-list">Template file list
    {% for templatefile in request.templatefiles %}
    <a class="uk-margin uk-form-small" href="http://{{request.templatefileurl}}/{{templatefile}}">{{templatefile}}</a>
    {% endfor %}
  </ul>
  <p class="uk-margin-top">Drag and drop your Excel file into the area below or click the icon to select it.</p>
  <div class="js-upload uk-placeholder uk-text-center uk-background-muted uk-padding-small">
    <div class="uk-text-right">
      <div uk-form-custom>
        <input id="fileinput" type="file" multiple/>
        <span class="upload-icon"><span uk-icon='icon: cloud-upload; ratio: 1.2'></span></span>
      </div>
    </div>
  </div>
  <progress id="js-progressbar" class="uk-progress" value="0" max="100" hidden></progress>

  <form id="work" class="uk-form" action="/contour/exec" method="POST">

    <div id="filelist" class="uk-margin">
    </div>

    <div id="sheetlist" class="uk-margin uk-grid-small uk-child-width-auto uk-grid">
    </div>

    <div class="uk-margin">
      <button id="execbutton" class="uk-button uk-button-default" type="submit" disabled>Draw Contour</button>
    </div>

    <div class="uk-margin">
      <span id="statusmsg"></span>
    </div>

  </form>

<script>
    function refresh_workspace(formid, infordata) {
      var filelist = document.getElementById('filelist');
      var sheetlist = document.getElementById('sheetlist');
      var filehtml = '';
      var sheethtml = '';
      var infor = JSON.parse(infordata).infor;
      filehtml += '<div>Output filename: ' + infor.outfname + '</div>\n';
      if(infor.sheets.length > 0) {
        sheethtml += '<p class="uk-margin">Check the sheet to be calculated.</p>\n';
        for(var j = 0; j < infor.sheets.length; j++) {
          var sheetname = infor.sheets[j];
          sheethtml += '<label>';
          sheethtml += '<input class="uk-checkbox" type="checkbox" name="sheetname" value="' + infor.sheets[j] + '"">';
          sheethtml += ' <span class="uk-text-emphasis">' + infor.sheets[j] +'</span></label>\n';
        }
      }
      sheetlist.innerHTML = sheethtml;
      filelist.innerHTML = filehtml;
      document.getElementById("execbutton").disabled = false;
    }

    var bar = document.getElementById('js-progressbar');

    UIkit.upload('.js-upload', {
      url: '/contour/upload',
      method: 'post',
      multiple: false,
      name: 'file',
      error: function () {
        console.log('error', arguments);
      },
      loadStart: function (e) {
        bar.removeAttribute('hidden');
        bar.max = e.total;
        bar.value = e.loaded;
      },
      progress: function (e) {
        bar.max = e.total;
        bar.value = e.loaded;
      },
      loadEnd: function (e) {
        bar.max = e.total;
        bar.value = e.loaded;
        refresh_workspace('work', e.target.response);
      },
      completeAll: function () {
        setTimeout(function () {
          bar.setAttribute('hidden', 'hidden');
        }, 1000);
      }
    });
  </script>

</div>

{% endblock %}
結果を表示するページのHTMLファイル。
report.html
{% extends "base.html" %}

{% block title %}Notice{% endblock %}

{% block head %}
{{ super() }}
{% endblock %}

{% block content %}

<div class="uk-container">

  {% if request.status=='OK' %}
  <ul class="uk-list">
    <li>Working sheet list</li>
    {% for sheetname in request.sheets %}
    <li class="uk-list-basic uk-text-bold">{{ sheetname }}</li>
    {% endfor %}
  </ul>

  {% else %}
  <p class="uk-margin">The specified file was refused processing. Please check the following.</p>
  <ul class="uk-list">
    <li>The Excel sheet is different from the one specified.</li>
    <li>The calculation sheet is not selected.</li>
  </ul>
  {% endif %}

  <h2>Crick to download following file.</h2>
  <ul class="uk-list">
    <li>
      <span class="uk-icon" uk-icon="download"></span>
      <a class="uk-link-heading uk-text-bold" href="http://{{ request.downloadurl }}">{{ request.filename }}</a>
    </li>
  </ul>

  <div class="uk-margin">
    {% for imgurl in request.imgurls %}
    <div id="graph{{ imgurl.name }}" class="uk-text-bold">
      <div class="uk-padding uk-padding-remove-horizontal uk-padding-remove-bottom">
        {{ imgurl.name }}
      </div>
      <div>
        <img src="http://{{ imgurl.url }}"
          style="box-shadow: 10px 10px 20px rgba(0, 0, 0, 0.5), -10px -10px 15px rgba(255, 255, 255, 0.3);">
      </div>
    </div>
    {% endfor %}
  </div>

  <div class="uk-margin">
    <span id="statusmsg">End line.</span>
  </div>

</div>

{% endblock %}
基本のページ設定。これを継承し各ページを作成する。
base.html
<!DOCTYPE html>
<html lang="ja">

<head>
  <meta charset="utf-8">
  <meta name="viewport" content="width=device-width, initial-scale=1">
  <link href="{{ url_for('static', path='/css/uikit.min.css') }}" rel="stylesheet">
  <script type=text/javascript src="{{ url_for('static', path='/js/uikit.min.js') }}"></script>
  <script type=text/javascript src="{{ url_for('static', path='/js/uikit-icons.min.js') }}"></script>
  <link rel="shortcut icon" href="#">
  {% block head %}
  <title>{% block title %}{% endblock %} - Contour</title>
  {% endblock %}
</head>

<body class="text-center">
  <header>
    <div class="uk-heading-small uk-container uk-heading-divider">
      Draw Contour
    </div>
  </header>
  <main>
    {% block content %}
    <!-- Contents -->
    {% endblock %}
  </main>
  <script>
    // Disable drag & drop
    window.addEventListener('dragover', function (e) {
      e.preventDefault();
    }, false);
    window.addEventListener('drop', function (e) {
      e.preventDefault();
      e.stopPropagation();
    }, false);
  </script>
</body>

</html>