Draw a contor graph into the .xlsx file
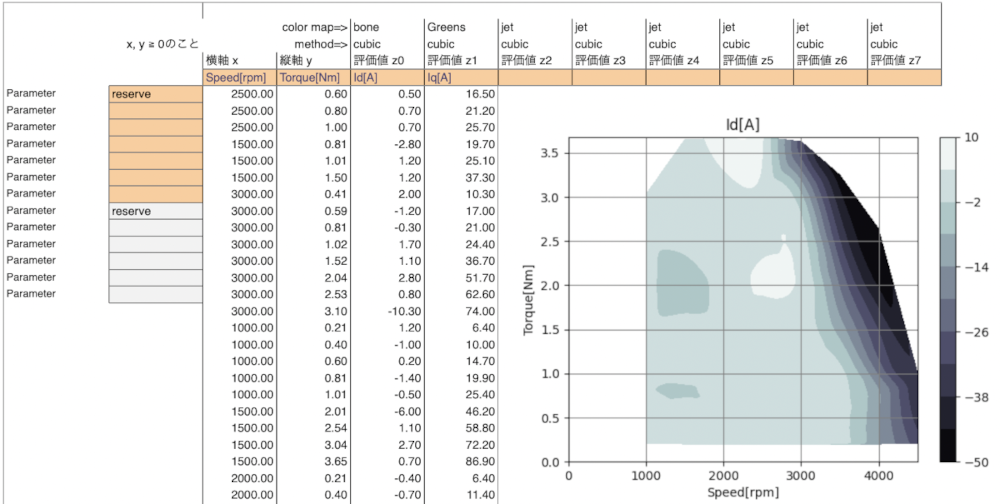
2軸で定義された粗めのデータ配列から補間演算をしてコンター図を作成する。UIはWebで。プラットフォームはstreamlitを利用。
他のプラットフォームへの実装についてはfastapiを利用した作例がある。
fastapiへの実装例
Data flow
データフローを下図に示す。contour_template.xlsx にデータを登録する。それをweb appでアップロードし計算後に結果ファイルをダウンロードする。結果ファイルにはコンター図が挿入される。
graph LR
    indata[input data]
    temp[contour_template.xlsx]
    src[input.xlsx]
    web[Web<br>Interpolating &<br>drawing contour]
    dist[output.xlsx]
    indata --> src
    temp --> src
    src --> web --> dist
requirements.txt
github で streamlit を利用するためには python で import するモジュールのバージョンを指定するファイルを用意する。
numpy==1.24.2
streamlit==1.9.0
matplotlib==3.7.0
openpyxl==3.1.1
scipy==1.10.1
pydantic==1.10.7
Source code
openpyxl を利用してエクセルファイルを操作する。補間は scipy の interpolate を使用しグラフは matplotlib で描画した。
#!/usr/bin/python3

import streamlit as st
import numpy as np
import openpyxl as px
import matplotlib.pyplot as plt
from pydantic import NoneIsAllowedError, NoneIsNotAllowedError
from scipy import interpolate
from io import BytesIO
import tempfile
from openpyxl.drawing.image import Image

TEMPFILENAME = "drawcontour_template.xlsx"
HEADER_POS = 'C5'       # excel cell position of parameters
GRAPH_POS = 'M6'        # excel cell position of drawing graph
GRAPH_POS_DEF = 26      # excel cell raw offset of drawing graph
N_POINTS = 2000         # contour resolution of x and y
N_LEVEL = 11            # color level N + 1
G_INIT = 0              # general initial state number of process
G_UPLOADED = 1          # general upload state number of process
G_END = 10              # general end state number of process

""" main process
    display screen
    button, download, upload
    in
        state: number of the process index
    out
        non
"""
def main(state):
    st.session_state['state'] = state
    st.header("Draw contour into .xlsx")
    # display download button for template file
    with open(TEMPFILENAME, "rb") as fdata:
        st.download_button("Download template .xlsx file",
                        data=fdata,
                        mime='xlsx',
                        file_name=TEMPFILENAME)
    st.session_state['state'] = G_INIT
    # display file uploader
    upfile = st.file_uploader("Upload xlsx file",
                type="xlsx",
                accept_multiple_files=False,
                key=None,
                help=None,
                on_change=None,
                args=None,
                kwargs=None,
                disabled=False)
    if upfile:  # after uploading
        st.session_state['state'] = G_UPLOADED
        # make a tempolary file and drawing contours in it
        with tempfile.NamedTemporaryFile() as tmp:
            st.session_state['state'] = draw_contour(upfile, tmp.name)
            fdata = BytesIO(tmp.read())
        # after drawing contours, display the download button
        if st.session_state['state'] == G_END:
            st.download_button("Download Result file",
                            data=fdata,
                            mime='xlsx',
                            file_name=upfile.name)

""" drawing contours
    check the worksheets
    display checkboxes, buttons
    in
        upfile: file like object
        outfilename: tempolary filename for drawing
    out
        res: number of process index
"""
def draw_contour(upfile, outfilename):
    wb = px.load_workbook(upfile, data_only=True)
    sheetnames = wb.sheetnames      # get the sheetnames of the workbook
    sheetlist = {}
    res = st.session_state['state']
    # display the checkboxes of the sheetnames
    for sheetname in sheetnames:
        sheetlist[sheetname] = st.checkbox(sheetname,
                                value=False,
                                key=sheetname,
                                help=None,
                                on_change=None,
                                args=None,
                                kwargs=None,
                                disabled=False)
    # display the button and drawing the contours of checked sheets
    if st.button('Draw Contour'):
        st.write('Drawing...')
        for sheetname in sheetnames:
            if sheetlist[sheetname]:
                contour(upfile, sheetname, outfilename)
        res = G_END
    return res

""" drawing a contour
    save the result workbook
    in
        fileobj: file like object
        in_shname: target sheetname
        outfilename: tempolary filename for drawing
    out
        non
"""
def contour(fileobj, in_shname, outfilename):
    wb, ws, x_label, y_label, z_label, x, y, z, cmaps, methods = set_parameter(fileobj, in_shname)
    make_contour(wb, ws, x_label, y_label, z_label, x, y, z, cmaps, methods)
    wb.save(outfilename)

""" set the parameters for drawing contour
    in
        in_fpath: file like object
        in_shname: target sheetname
    out
        wb: workbook object
        ws: worksheet object
        x_label: x axis label string
        y_label: y axis label string
        z_label: z axis label string
        x: the 1D array of x
        y: the 1D array of y
        z: the 1D array of z
        cmaps: list of color map
        methods: list of interpolating method
"""
def set_parameter(in_fpath, in_shname):
    # open workbook as data, ignore formula for reading parameters
    wb = px.load_workbook(in_fpath, data_only=True)
    ws = wb[in_shname]
    wb.active = ws
    x_label = ws[HEADER_POS].value
    y_label = ws[HEADER_POS].offset(0, 1).value
    z_label = []
    methods = []
    cmaps = []
    x = np.array([])
    y = np.array([])
    for col in ws.iter_cols(min_row=5, min_col=5, max_row=5):
        for head in col:
            if not head.value is None:
                z_label.append(head.value)
                methods.append(head.offset(-2, 0).value)
                cmaps.append(head.offset(-3, 0).value)
    for row in ws.iter_rows(min_row=6, min_col=3, max_col=4):
        if is_num(row[0].value):
            x = np.r_[x, float(row[0].value)]
        if is_num(row[1].value):
            y = np.r_[y, float(row[1].value)]
    n_z = len(z_label)
    n_data = np.size(x, 0)
    z = np.array([])
    for col in ws.iter_cols(min_row=6, min_col=5, max_row=5+n_data, max_col=4+n_z):
        if not col[0].value is None:
            zi = np.array([])
            if np.size(z) == 0:
                for data in col:
                    if is_num(data.value):
                        zi = np.r_[zi, float(data.value)]
                z = np.array([zi,])
            else:
                for data in col:
                    if is_num(data.value):
                        zi = np.r_[zi, float(data.value)]
                z = np.r_[z, [zi]]
    # open workbook as not ignore formula
    wb = px.load_workbook(in_fpath, data_only=False)
    ws = wb[in_shname]
    wb.active = ws
    return wb, ws, x_label, y_label, z_label, x, y, z, cmaps, methods

""" drawing contour
    interpolate grid as high resolution from input parameter
    draw the contour from interpolated data.
    in
        wb: workbook object
        ws: worksheet object
        x_label: x axis label string
        y_label: y axis label string
        z_label: z axis label string
        x: the 1D array of x
        y: the 1D array of y
        z: the 1D array of z
        cmaps: list of color map
        methods: list of interpolating method
    out
        non
"""
def make_contour(wb, ws, x_label, y_label, z_label, x, y, z, cmaps, methods):
    wGraph = ws[GRAPH_POS]
    pos = wGraph
    xmin = 0    # np.min(x)
    xmax = np.max(x)
    ymin = 0    # np.min(y)
    ymax = np.max(y)
    x1 = np.linspace(xmin, xmax + xmax/N_POINTS, N_POINTS)
    y1 = np.linspace(ymin, ymax + ymax/N_POINTS, N_POINTS)
    xx, yy = np.meshgrid(x1, y1)
    zz = np.array([])
    zzi = np.array([])
    n_z = len(z_label)
    for i in range(n_z):
        if np.size(zz) == 0:
            zz = interpolate.griddata((x,y), z[i], (xx, yy), method=methods[i])
            zz = np.stack([zz,])
        else:
            zzi = interpolate.griddata((x,y), z[i], (xx, yy), method=methods[i])
            zz = np.concatenate([zz, [zzi]])
    for i in range(n_z):
        zmax = np.max(z[i])
        zmin = np.min(z[i])
        if zmax < 0:
            lv0 = zmin
            lv0 = -np.ceil(-zmin/10.0)*10.0
            lvf = 0
        elif zmin > 0:
            lv0 = 0
            lvf = zmax
            lvf = np.ceil(zmax/10.0)*10.0
        else:
            lv0 = zmin
            lv0 = -np.ceil(-zmin/10.0)*10.0
            lvf = zmax
            lvf = np.ceil(zmax/10.0)*10.0
        fig = plt.figure()
        plt.contourf(xx, yy, zz[i], levels=np.linspace(lv0, lvf, N_LEVEL), cmap=cmaps[i])
        plt.title(z_label[i])
        plt.xlabel(x_label)
        plt.ylabel(y_label)
        plt.grid(which='major', color='gray', linestyle='-')
        plt.colorbar()
        buffer = BytesIO()
        fig.savefig(buffer, format='png')
        buffer.seek(0)
        img = Image(buffer)
        ws.add_image(img, pos.coordinate)
        pos = pos.offset(GRAPH_POS_DEF, 0)
        st.write(fig)

""" check the float type
    in
        s: string of float
    out
        bool: if s is number then True, not number then False
"""
def is_num(s):
    try:
        float(s)
    except ValueError:
        return False
    except NoneIsNotAllowedError:
        return False
    except NoneIsAllowedError:
        return False
    except TypeError:
        return False
    else:
        return True

"""
    start
"""
if __name__ == '__main__':
    main(G_INIT)